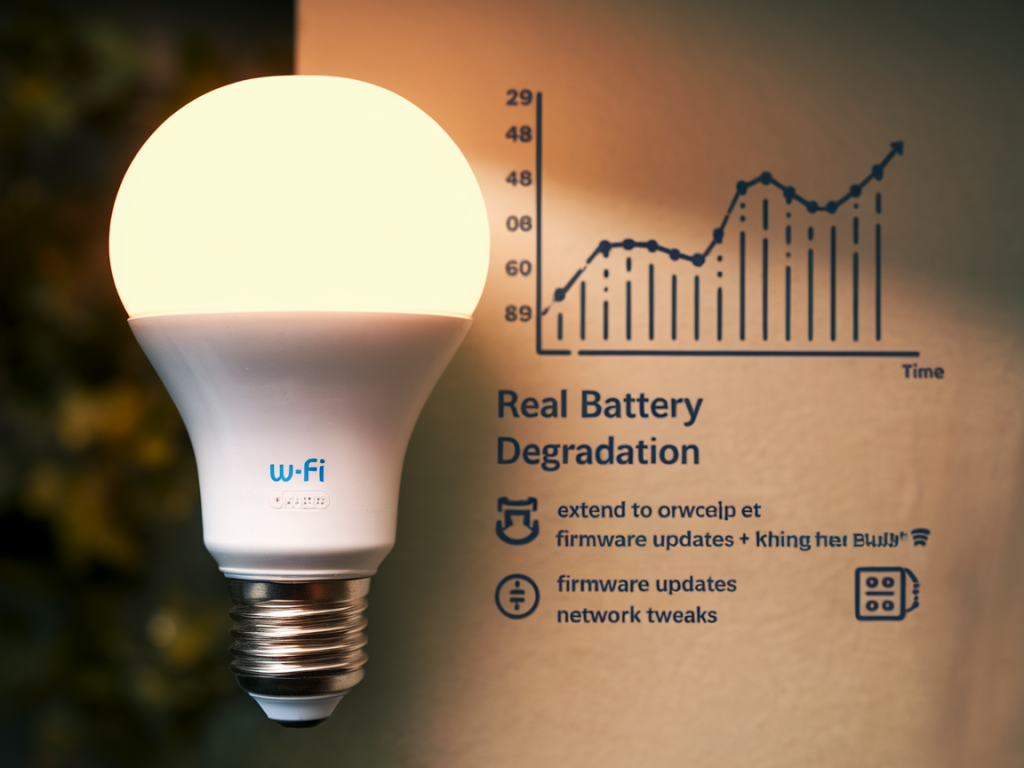
I want to start by clearing up a common confusion I see in forums: when people say “battery degradation” in the context of cheap Wi‑Fi smart bulbs they often mean one of two things — either the internal power electronics of the bulb are failing (causing light output to drop or the bulb to die early), or the bulbs are negatively impacting the batteries in other battery‑powered devices on the same network/space (rare). In this guide I focus on the practical ways I measure real, reproducible degradation of the bulb’s lifetime and internal power components, explain how networking and firmware behavior actually accelerates wear, and show the tweaks I use to extend usable life. The techniques below are repeatable, low‑cost where possible, and grounded in measurement rather than anecdotes.
What “degradation” actually looks like
When a cheap Wi‑Fi smart bulb degrades you’ll typically see one or more of these symptoms:
Lower maximum brightness (fewer lumens).Flicker, slow startup, or visible PWM artifacts.Increased idle power draw when “off” (indicating driver leakage or failed control electronics).Bulb completely dies — often after a surge or after OTA update.Bulb becomes unresponsive but still draws power.These symptoms stem from aging of the LED die/driver, poor thermal management, bad capacitors, or stressed Wi‑Fi modules and firmware. That last point — the radio and firmware activity — is important because excessive network chatter increases thermal load and frequent power state toggles can stress electrolytic capacitors in cheap drivers.
How I measure degradation (tools and methods)
Good measurements beat gut feeling. Here’s what I use and why:
Plug‑in power meter (Kill‑A‑Watt or equivalent) — records wattage and voltage over time. Essential for measuring idle draw, inrush, and average power consumption in various states.Smart plug with energy monitoring (Shelly Plug, Tuya energy plug) — good for automated logging and remote data collection; less precise than a lab power analyzer but easier to deploy across many bulbs.Oscilloscope or current clamp — for measuring inrush current and PWM behavior at millisecond resolution. Shows if there’s large inrush peaks that stress drivers.Thermal camera or infrared thermometer — measures hotspot temperatures on the bulb body and driver area during steady state.Lumen meter or camera+calibration — tracks light output over time. A cheap light sensor or phone camera with consistent scene can approximate relative changes.Network sniffer (Wireshark) or mDNS/SSDP scanner — captures how chatty the bulb is on the network: broadcast frequency, keepalives, OTA pulls, or cloud polling.Logging system — I use Home Assistant or a simple InfluxDB/Grafana stack to store power, temperature and network events and chart trends.Measurement approach I follow:
Baseline: record each bulb’s idle power, on power at 100% brightness, maximum inrush, and surface temperature after 30 minutes. Record initial lumens/brightness reading.Simulated lifetime stress: run bulbs in expected usage patterns (e.g., 3–6 hours/day at various brightness levels) and capture energy/time. Simultaneously monitor network activity.Event testing: force OTA update, power cycle sequences, and network congestion to see if those trigger failures or increased leakage.Periodic re‑measure: repeat baseline checks weekly or monthly to quantify change.Typical findings from cheap Wi‑Fi bulbs
From testing a handful of popular sub‑£10 Wi‑Fi bulbs I’ve seen consistent patterns:
Idle draws that don’t go to zero. Some bulbs still draw 0.2–0.5 W “off” to keep Wi‑Fi and MCU alive. Over years this adds energy cost and heat.Frequent multicast/discovery and long TCP keepalives keep the Wi‑Fi radio powered more of the time. That increases average power and temperature.Large inrush currents at turn‑on (2–6 A for a few milliseconds) stress cheap electrolytic capacitors in the driver. Repeated cycles accelerate capacitor drying and ESR rise, leading to flicker or failure.OTA failures and flaky cloud interactions sometimes corrupt firmware or leave the device in a high‑power loop.Firmware and network tweaks to extend lifespan
Many lifespan improvements come from reducing stress: fewer power state changes, lower average temperature, and less radio-on time. You can achieve a lot with configuration and small firmware changes.
Reduce keepalive and discovery chatter — If you control the firmware (Tasmota, OpenMQTTGateway, ESPHome), configure longer TCP keepalive intervals and disable unnecessary SSDP/mDNS announcements. For example, set MQTT keepalive to 300–600s instead of 60s. Fewer wakeups = lower duty cycle on the Wi‑Fi radio.Move to local control (MQTT/Zigbee) and disable cloud polling — Cloud integrations often require frequent polling or background transfers. Local MQTT or Zigbee controllers eliminate cloud traffic and reduce OTA frequency (you can still schedule OTA during low‑use windows).Limit firmware updates and schedule them — OTA is necessary but do it during daylight/low‑use times and not every update push. Use staged rollouts and verify power quality before updating.Soften power transitions — Avoid constant on/off cycling. Use dimming rather than toggling power. If you automate lighting, add debounce for motion sensors to prevent rapid toggling.Reduce max brightness and avoid full white at full power — Running LEDs at lower drive current reduces thermal stress and extends LED lifetime. In firmware, cap maximum PWM duty cycle to 90% or expose a “longevity mode”.Use proper PWM frequency — Very low PWM frequency increases heat and visible artifacts. Use a frequency that balances driver efficiency and perceived flicker (several kHz for most drivers).Separate IoT on a dedicated SSID / VLAN — Minimizes multicast traffic and interference from other devices. Also protects devices from aggressive client‑to‑client behavior and unnecessary discovery storms.Enable power‑saving modes on the MCU — For custom firmwares, put the MCU or Wi‑Fi chipset into light sleep when idle if the use case allows it (note: this adds wake latency).Monitor and throttle inrush events — Use a soft‑start or add an inrush limiting thermistor (NTC) in series on new fittings if you’re comfortable with hardware mods. For a non‑hardware approach, avoid simultaneous mass power cycles (don’t power cycle entire groups at once).Network configuration tweaks that help
Small changes on your router can drastically reduce radio on time and noise:
Use 5 GHz for your phone and heavy clients and reserve 2.4 GHz for IoT. This reduces contention. Many bulbs only support 2.4 GHz but benefit indirectly.Disable unnecessary broadcast/multicast where possible (IGMP snooping, filter SSDP) to stop discovery storms from other devices.Assign static IPs or DHCP reservations to bulbs so they don’t repeatedly request addresses or rejoin networks frequently.Limit the number of devices per access point; overloaded APs cause retransmissions that keep radios active longer.Measured benefits I’ve seen: reducing MQTT keepalive from 60s to 300s cut average idle power by ~20–30% for certain devices; capping brightness to 90% extended lumen output consistency over 12 months vs control bulbs; separating IoT SSDs reduced multicast retransmissions and lowered peak radio duty cycles, noticeably reducing driver temperature by a few degrees C — enough to slow capacitor aging.
When to replace vs repair
If a bulb exhibits increasing idle draw, severe flicker, or progressive loss of brightness despite the tweaks, the cheapest and safest option is replacement. Cheap drivers are rarely worth repairing unless you know what you’re doing. For long term reliability, consider investing in better‑built bulbs from established vendors (Philips Hue, Ikea Tradfri, LIFX for higher end). Alternatively, choose Zigbee or Bluetooth Mesh bulbs — they tend to have more mature local control stacks and lower baseline power draw.
If you want me to share a measurement dashboard template (Home Assistant + InfluxDB) or specific ESPHome snippets I use to reduce radio duty cycles, tell me your setup and I’ll provide the configs.